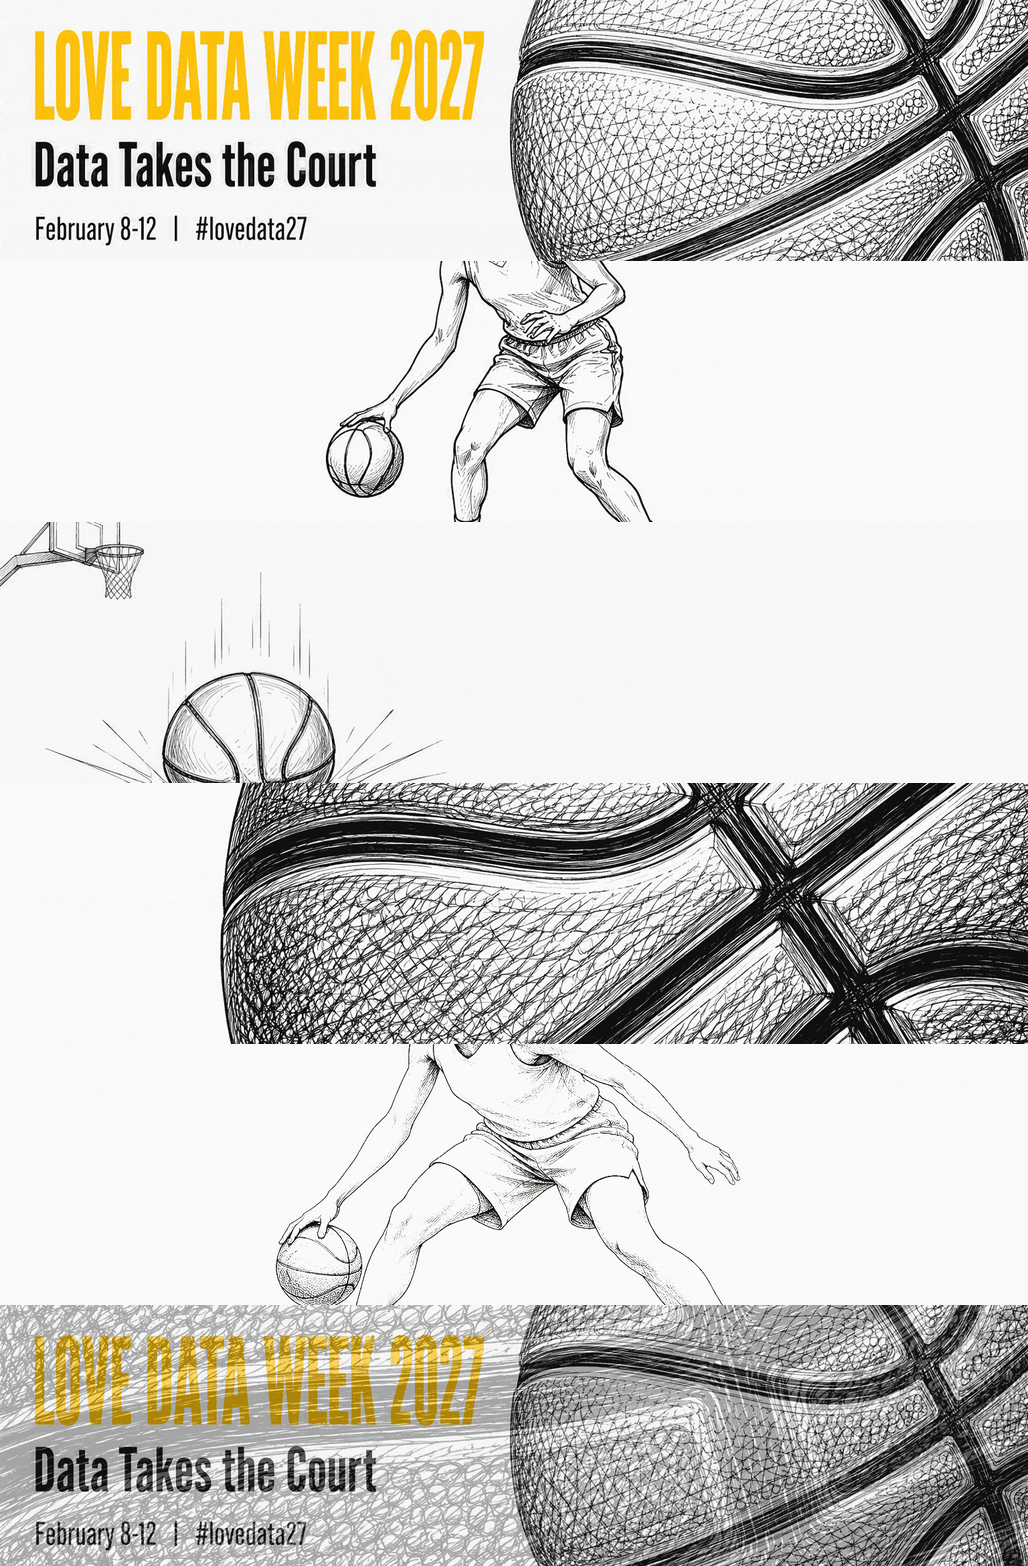

Save the date! Love Data Week 2027 will take place February 8-12.
Love Data Week is an annual celebration of data that brings together Big Ten Academic Alliance universities to explore, share, and celebrate the role of data in research, teaching, and learning. Throughout the week, participating institutions offer opportunities to build data literacy skills, discover tools and methods, and connect with others who work with data.
The University of Iowa will participate in Love Data Week through campus programming and the 2027 Big Ten Academic Alliance Data Visualization Championship (details below). Additional information about University of Iowa events and competition submissions will be posted as it becomes available.
Show Off Your Skills in the 2027 BTAA Love Data Week Data Visualization Championship!

The University of Iowa is participating in the Big Ten Academic Alliance Love Data Week Data Visualization Championship, an annual competition that gives students, faculty, and staff from Big Ten universities an opportunity to showcase their data visualization skills.
The University of Iowa will hold an internal competition to select visualizations for submission to the BTAA championship. Entries will be evaluated using the criteria described below. Selected participants will receive recognition through University of Iowa communications and may be eligible for prizes or other recognition associated with the Iowa and BTAA competitions.
Competition requirements and judging criteria are subject to change if the BTAA issues updated guidance for 2027.
Requirements for Students
The theme of the 2027 student Data Visualization Championship is NCAA women’s basketball. Students must use the dataset selected by the BTAA for the competition.
The dataset contains NCAA women’s college basketball data sourced from ESPN and processed through the SportsDataverse wehoop data ecosystem. It includes three primary types of data:
- Play-by-play data, with one record for each event in a game
- Team box scores, with one record for each team in each game
- Player box scores, with one record for each player in each game
The data may also include supporting information about schedules, teams, conferences, and rankings. Depending on the method of access, files may be available in CSV, Parquet, or RDS format.
Students are encouraged to explore questions, patterns, and stories within the data and communicate their findings through an engaging visualization. Participants may use familiar formats, such as bar charts, line charts, scatterplots, heat maps, maps, timelines, network diagrams, Sankey diagrams, or other appropriate visual forms. Infographics must include at least one valid data visualization rather than relying solely on text or decorative elements.
Additional guidelines:
- Visualizations must present data accurately, clearly, and ethically.
- Data sources must be cited.
- Visual elements should be accessible to a broad audience. Participants should consider features such as readable fonts, appropriate use of color, alternative text, labels, and captions.
- The visualization format should be appropriate for the data and the story or question being explored.
- Participants should avoid misleading design choices, unsupported causal claims, and inconsistencies between the data and the visualization.
- Students may collaborate, but all contributors must be credited and one person should be identified as the primary contact.
- Visualizations must be available through a link that does not require viewers or judges to log in.
- Participants are encouraged to be creative and have fun.
Requirements for Faculty and Staff
Faculty and staff are invited to submit visualizations that showcase their research, projects, programs, or institutional insights.
Unless the BTAA issues different guidance for 2027, faculty and staff may use University of Iowa data, data covering multiple BTAA institutions, or another dataset appropriate to the topic being explored. Participants may also submit an existing visualization developed through their work at the University of Iowa.
Visualizations may address the university as a whole or focus on a particular initiative, program, community, or area of inquiry.
Additional guidelines:
- All submissions must comply with applicable University of Iowa policies and requirements for data access, privacy, security, use, and accessibility.
- Visualizations must present data accurately, clearly, and ethically.
- Data sources must be cited.
- Visual elements should be accessible to a broad audience. Participants should consider features such as readable fonts, appropriate use of color, alternative text, labels, and captions.
- Faculty and staff may collaborate, but all contributors must be credited and one person should be identified as the primary contact.
- Visualizations must be available through a link that does not require viewers or judges to log in.
Existing visualizations are eligible if they meet the applicable competition requirements
BTAA LDW Site
An overview of all you need to know about BTAA Love Data Week activities.
Download Student Data
Go to the data page to download the student visualization dataset on NCAA women's college basketball!
Submit your visualization!
Ready to submit your visualization for the BTAA competition? Click below to fill out our submission survey.
Share LDW Flyer
Got a group of University of Iowa students you want to share BTAA Love Data Week information with? Download our flyer!
How Visualizations Will Be Evaluated
For planning purposes, the University of Iowa expects to use the four judging categories from the 2026 BTAA Data Visualization Championship. Each category was previously scored on a scale from 1 to 10. The criteria may be revised if the BTAA releases an updated 2027 judging guide.
Visual Design and Presentation
Judges will consider:
- Whether the visualization is appropriate for the story being told
- Whether it is easy to understand and navigate
- Whether fonts, labels, captions, colors, spacing, and layout support readability
- Whether the visualization is accessible to a broad audience
Strong submissions will demonstrate visual clarity, thoughtful use of design elements, and a polished, professional presentation.
Clarity of Communication
Judges will consider:
- Whether the visualization explores a clear question or tells a coherent story
- Whether it provides enough context for the audience to understand its meaning
- Whether findings and insights are communicated clearly
- Whether the data are presented accurately and without bias
- Whether all data sources are cited
Strong submissions will be understandable on their own and will communicate a compelling, well-supported message.
Creativity and Innovation
Judges will consider whether the visualization uses effective and original visual elements to strengthen the story and generate interest or insight.
Creativity does not require an unusual or complicated format. An effective submission may use a familiar chart type in a thoughtful way, provided that the design supports the data and the intended message.
Audience Understanding and Insight
Judges will consider:
- Whether the visualization reveals meaningful findings in the data
- Whether it helps viewers understand the topic
- Whether it guides viewers through the story
- Whether it encourages viewers to make connections or draw informed conclusions
Strong submissions will engage the audience while making the underlying information easier to interpret.
Data Accuracy and Ethical Visualization
Submissions should avoid misleading or inconsistent representations of data. Examples of concerns identified in the prior BTAA judging guide include:
- Truncating the vertical axis in a way that exaggerates differences, particularly in bar charts
- Implying that correlation establishes causation when the data do not support that conclusion
- Selecting a chart type that does not fit the data or intended message
- Violating common visual conventions in ways that make the visualization difficult to interpret
- Omitting important labels, captions, context, or data-source information
A submission that does not contain a valid data visualization may be ineligible for scoring. Misleading visualizations or serious inconsistencies may also substantially affect scores across the judging categories.
How to Submit a Visualization
University of Iowa submission instructions and the 2027 submission deadline will be posted on this page when they are available.
Participants should expect to provide:
- The visualization title
- A link to the completed visualization
- The names of all contributors
- A primary contact
- A brief description of the question, story, or insight explored
- Citations for the data sources used
Questions about the University of Iowa competition may be directed to ui-data-literacy@uiowa.edu.